Description
A comprehensive debugging toolkit for WordPress developers and site administrators. This plugin gives you complete control over WordPress debugging without editing wp-config.php files or using FTP.
Quick Demo
Key Features
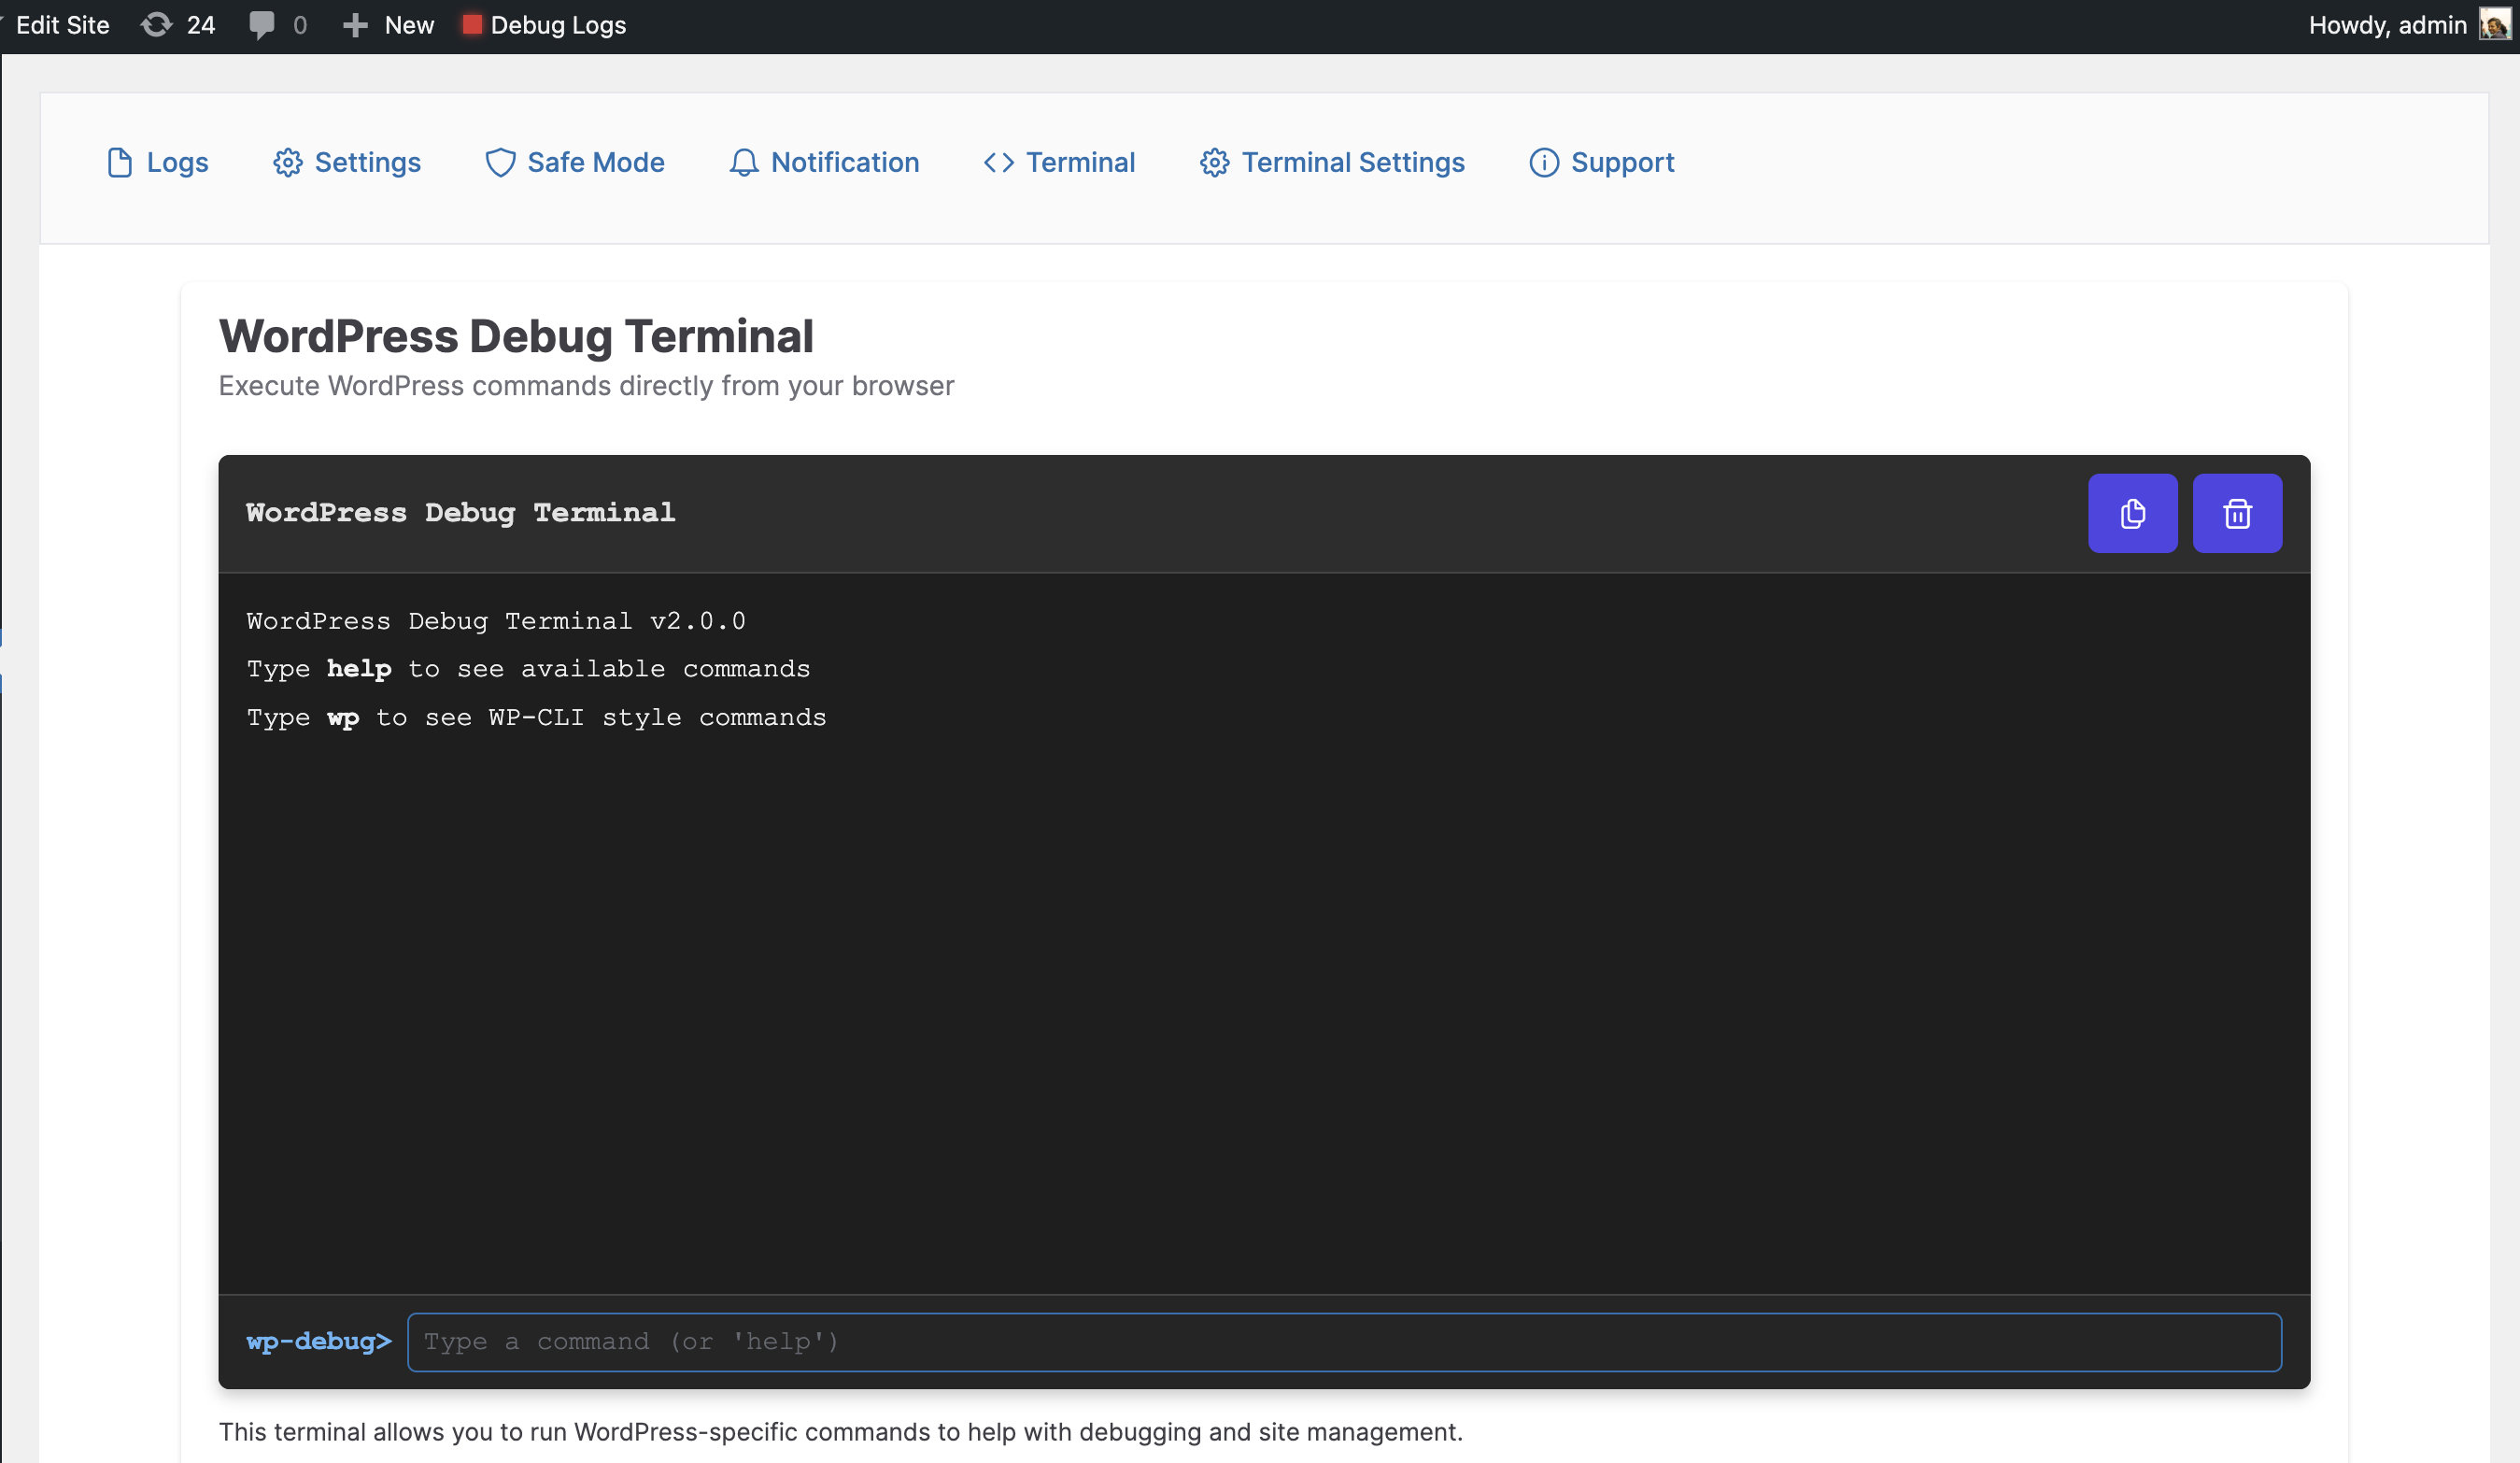
- WP-CLI Style Terminal: Execute WordPress commands directly from your browser with syntax highlighting and auto-completion
- Database Tools: Run SQL queries, view table structures, and optimize your database (super admin only)
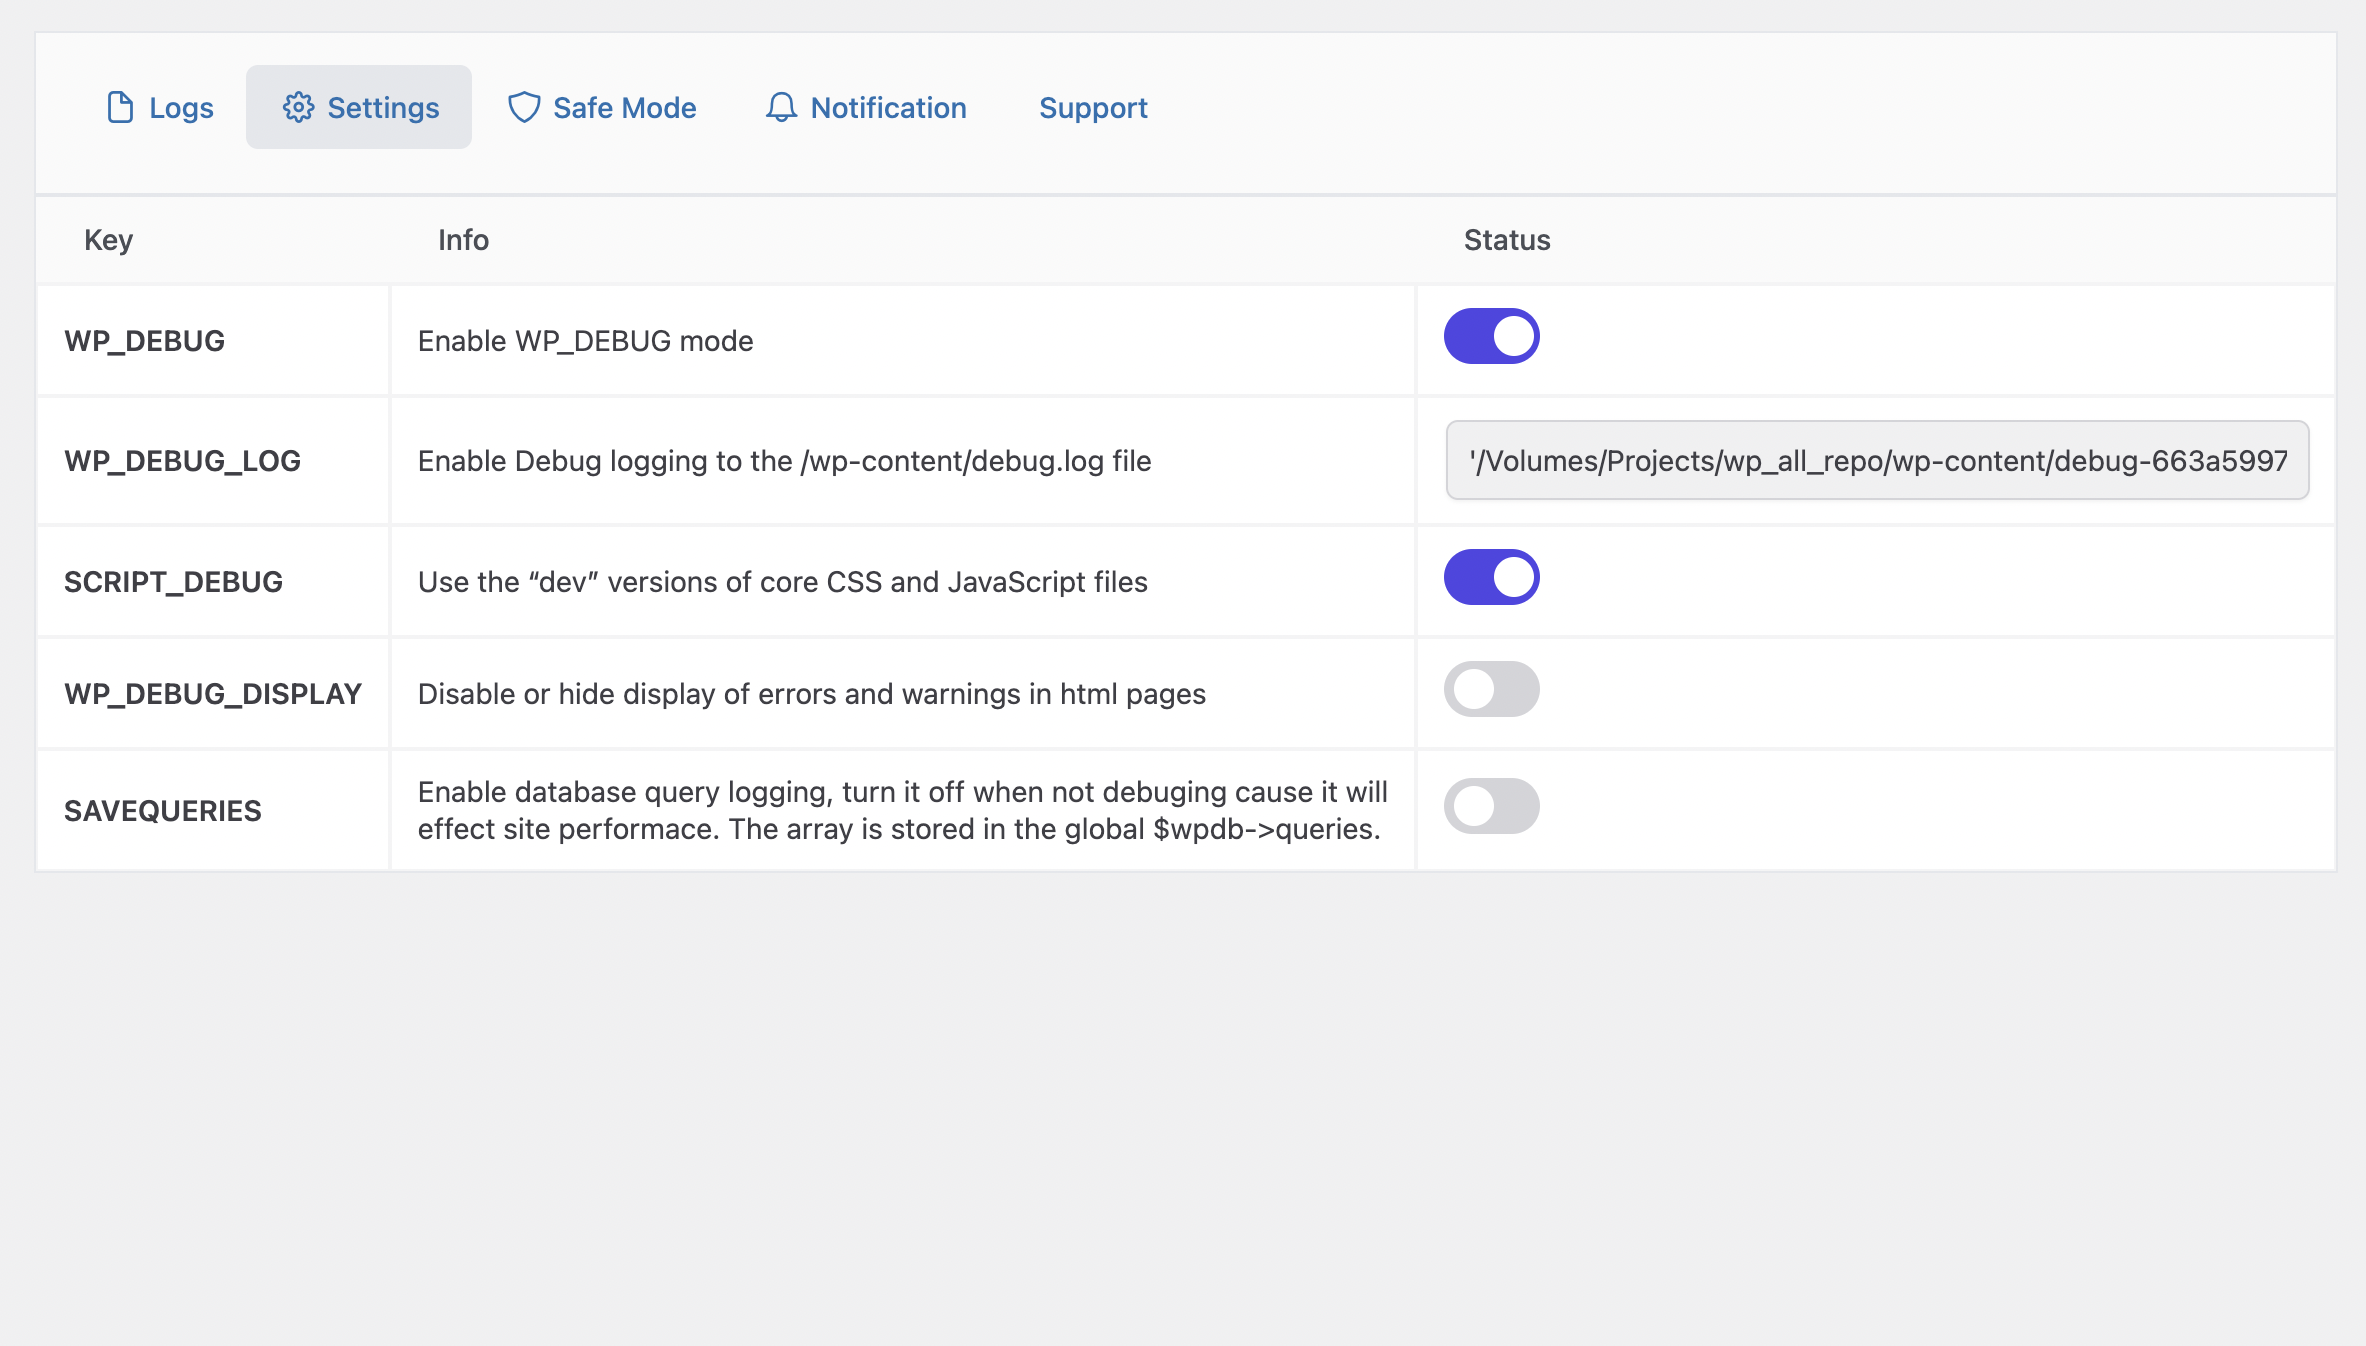
- Debug Constants Manager: Toggle all WordPress debug constants with a single click
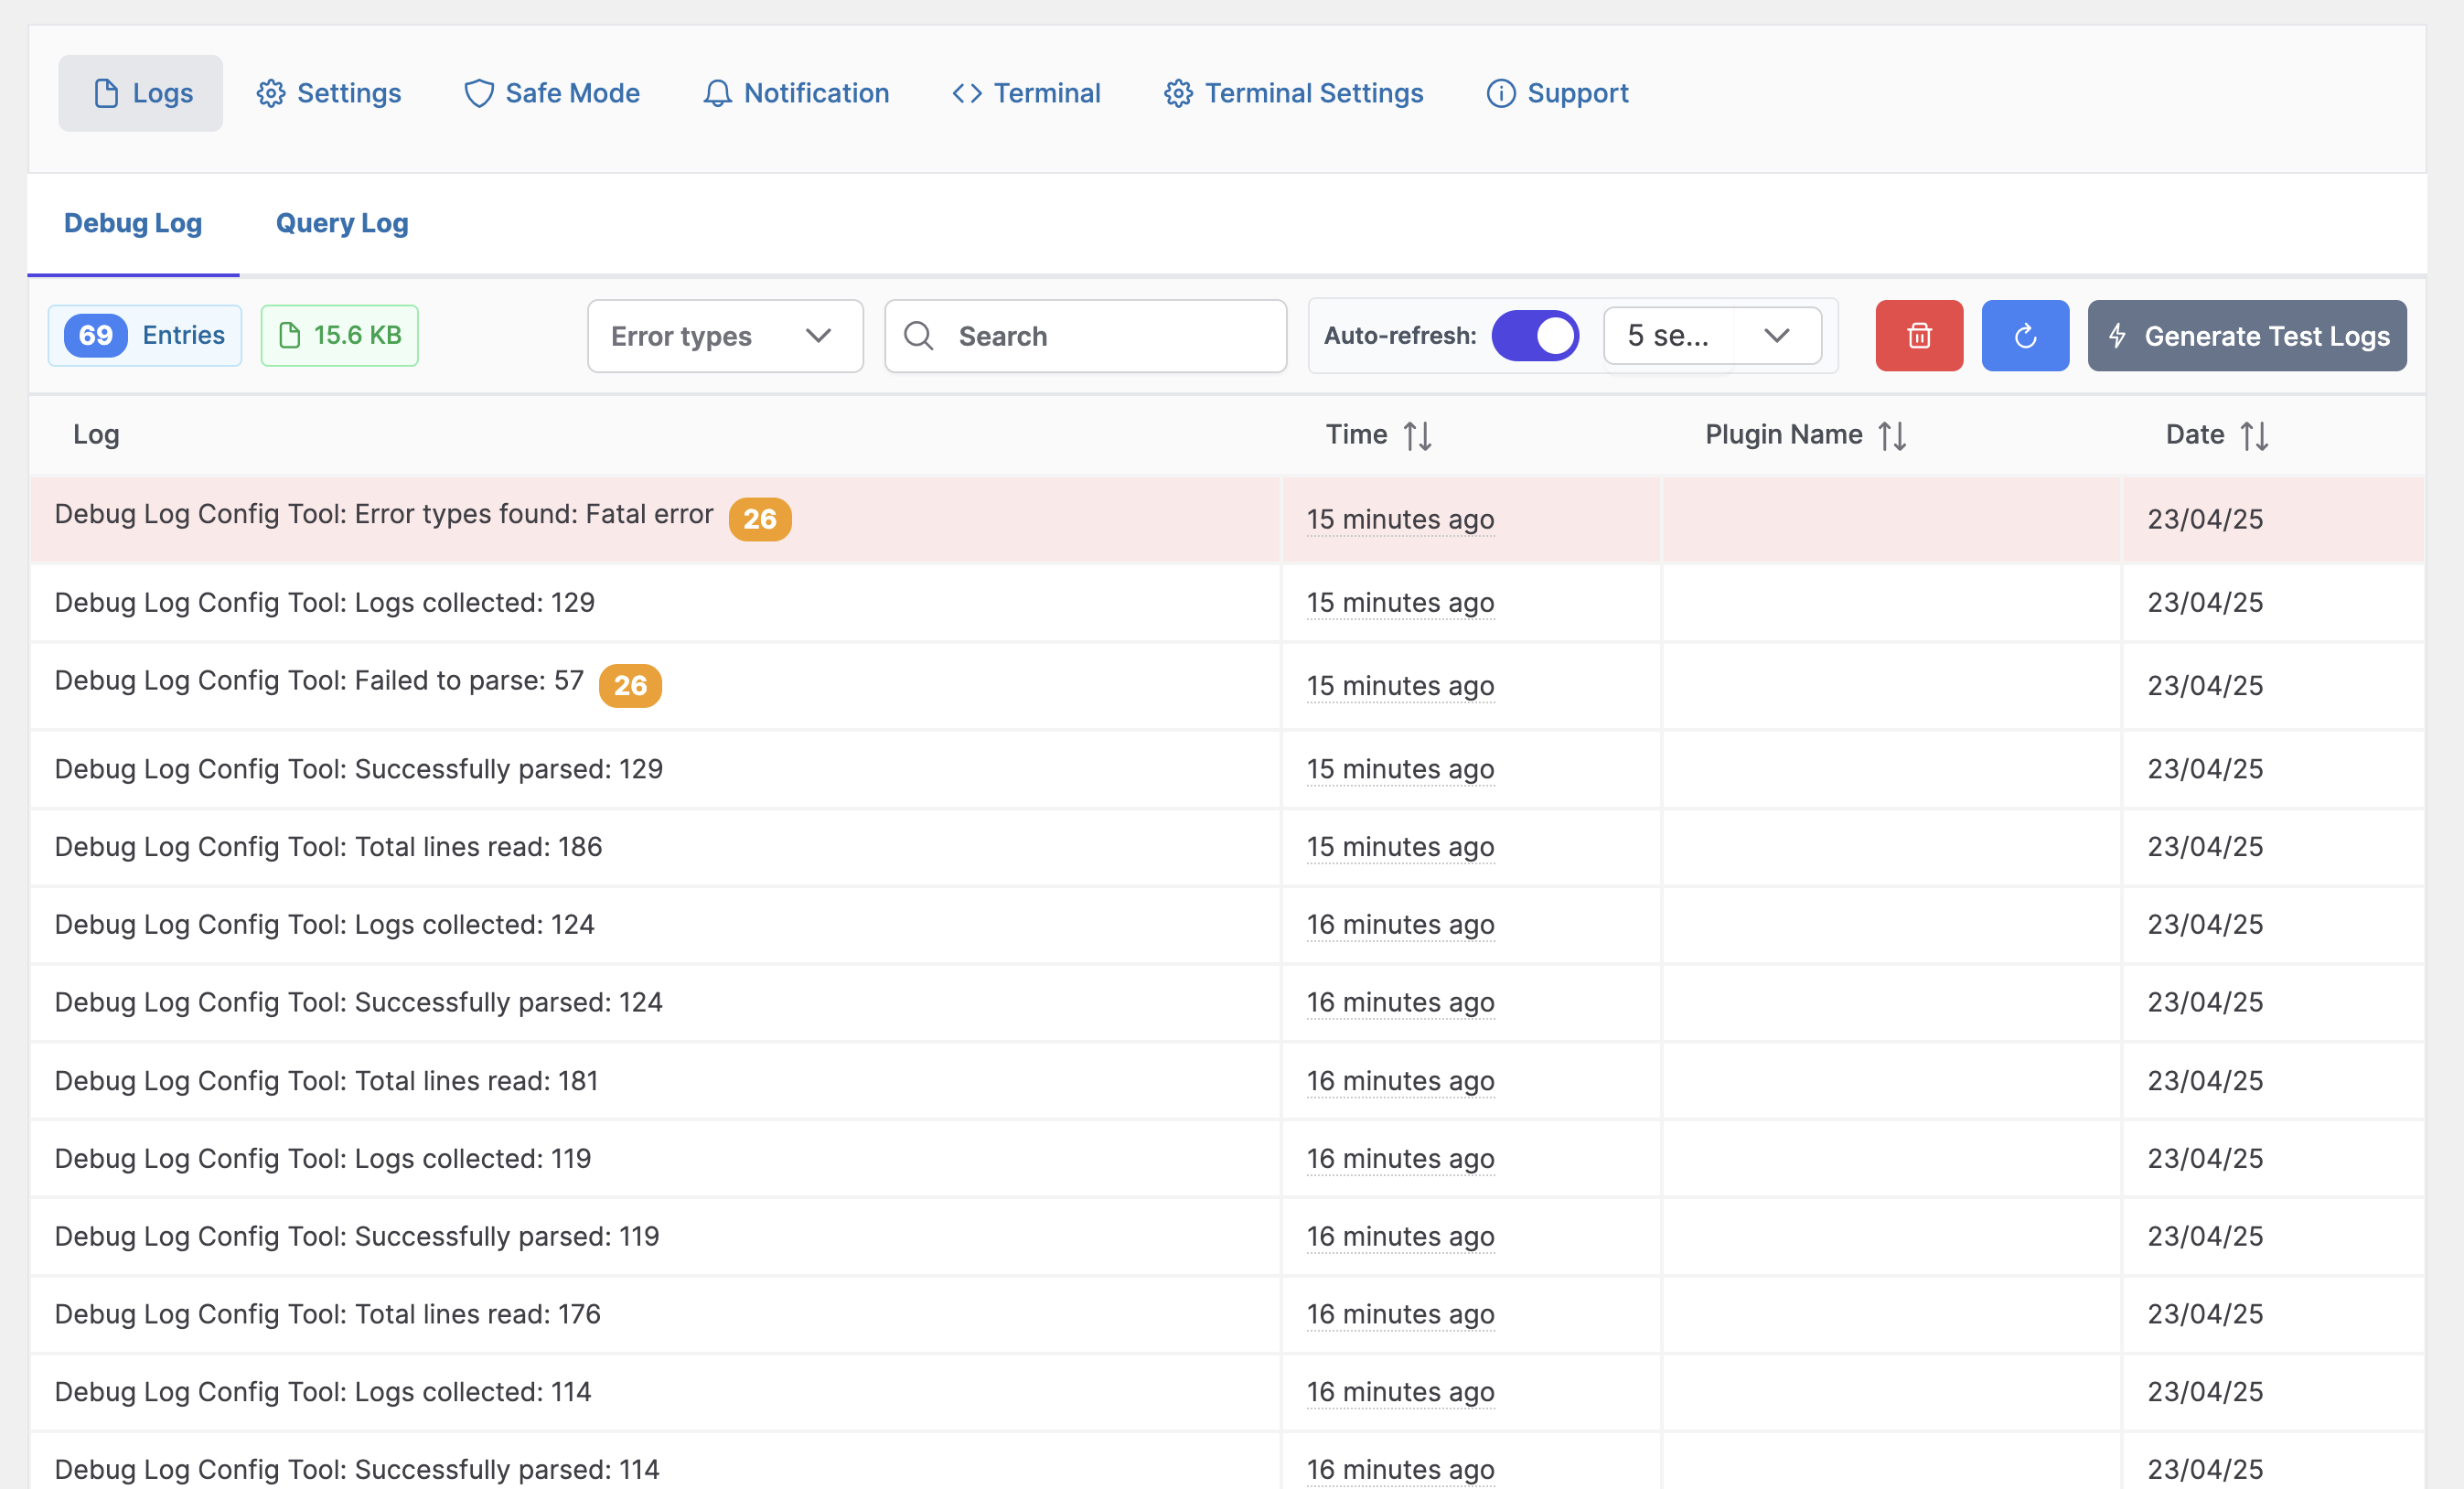
- Log Viewer: View, filter, and analyze debug logs with syntax highlighting and error categorization
- Query Inspector: Examine database queries with SAVEQUERIES support
- Email Notifications: Get alerts when new errors appear in your logs
- Safe Mode: Quickly disable all plugins except selected ones for troubleshooting
- Custom Log Paths: Set custom log file locations with filter support
Debug Constants Available
- WP_DEBUG – Default Value: true – Enables WordPress debug mode
- WP_DEBUG_LOG – Default Value: true – Saves all errors to a debug.log file
- SCRIPT_DEBUG – Default Value: false – Uses development versions of core JS and CSS files
- WP_DEBUG_DISPLAY – Default Value: false – Controls whether debug messages display on screen
- SAVEQUERIES – Default Value: false – Saves database queries for analysis
Developer Tools
- Terminal Commands: Use WP-CLI style commands like
wp core versionorwp plugin list - Database Explorer: Run SELECT queries and view results in a formatted table
- Stack Trace Analysis: Visualize error stack traces for easier debugging
- Hook Inspector: View all registered hooks and their callbacks
- Environment Detection: Development features are automatically hidden in production
Developer API: Apply custom filters like
apply_filters('wp_debuglog_log_file_path', $file);to extend functionality
Please note: Constant values will be restored on plugin deactivation as it was before activating the plugin.
Installation
- Upload the plugin files to the
/wp-content/plugins/debug-log-config-tooldirectory, or install the plugin through the WordPress plugins screen directly. - Activate the plugin through the ‘Plugins’ screen in WordPress
- Go to Tools-> Debug Logs screen to see the debug logs or access it from the top navbar.
FAQ
-
Do I need file manager/ftp or modify wp-config.php fie ?
-
No, just activate the plugin and turn off/on debug mode from plugin settings
-
Can I see full debug in dashboard?
-
Yes you can see a simple log in dashboard widget and nicely formatted view in the plugin
-
What does safe mode do?
-
Safe mode will deactivate all the plugin except the selected one. When you turn safe mode off it will restore all the previous activated plugin.
Reviews
Contributors and Developers
“Debug Log – Manager Tool” is open source software. The following people have contributed to this plugin.
ContributorsTranslate “Debug Log – Manager Tool” into your language.
Interested in development?
Browse the code, check out the SVN repository, or subscribe to the development log by RSS.
Change Log
2.0.1
- Fix typo
- Fix memory issue
2.0.0
- Added WP-CLI style command structure in terminal (e.g.,
wp core version) - Added database commands with WP-CLI syntax (
wp db query,wp db tables, etc.) - Added terminal settings page to enable/disable terminal and database features
- Added super admin restriction for database commands
- Added support for SQL queries with proper security measures
- Added stack trace visualization for better error analysis
- Help command to show commands by category with organized sections
- Enhanced security for terminal commands (preventing SQL injection, restricting destructive commands)
- Quick Debug Toggle from admin bar (WP_DEBUG)
1.5.3
- Fix footer text on all page
1.5.2
- Added query logs
1.5
- Fixed Vulnerability of debug log file. Generating random file for debug.
- Added a new safe mode which will turn off all plugins excluding selected ones.
1.4.5
- Fixed refresh
1.4.2
- New Constants
- Removed database dependency
1.4.4
- Fixed Refresh Log
- Added dashboard widget
- Clean UI
- Refresh Log
- Email Notification
1.0.0
- Initial Version


